SCAI Project Management Dashboard
Python | Power BI | SQL | Excel | T-SQL
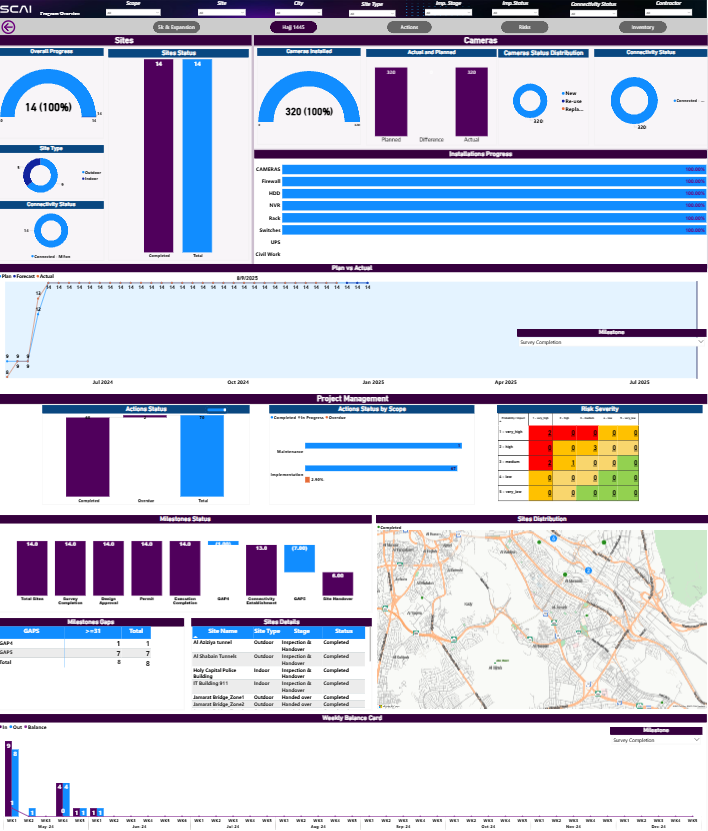
This dashboard, titled "SCAI Dashboard," is a comprehensive project management and operational monitoring tool. It is designed to provide a high-level overview of a project's status, from site and camera installation progress to milestones and risk management.
Key features of this dashboard include:
-
Overall Progress: At-a-glance KPIs for "Overall Progress," "Sites," and "Cameras Installed," providing a clear summary of project completion. The use of circular progress bars and large, bold numbers makes these metrics immediately understandable.
-
Detailed Status Breakdown: The dashboard provides granular detail on various aspects of the project, including:
-
Site Status: A bar chart showing the number of sites in different states (e.g., "Completed," "In Progress").
-
Camera Status Distribution: A breakdown of camera states, such as "New," "In Use," or "Replaced."
-
Connectivity Status: A pie chart and bar chart illustrating the connectivity of sites, showing "Connected" versus "Disconnected."
-
-
Installation Progress: A detailed breakdown of the installation progress for various components like "Cameras," "Firewall," "Router," "Rack," "Switches," "UPS," and "Clocks," providing a clear picture of what has been completed and what is pending.
-
Project Management Metrics: The lower half of the dashboard focuses on project management, with sections dedicated to:
-
Actions Status: A bar chart tracking the progress of project actions.
-
Milestones Status: A series of bar charts and a table providing a detailed view of project milestones and their completion status.
-
Risk Severity: A heat-map-style grid that visually represents the severity and impact of various project risks.
-
-
Geospatial Visualization: An integrated map showing the physical locations of sites, allowing for a geographical context of the project's progress and site distribution.
-
Weekly Performance Analysis: A "Weekly Balance Card" and a bar chart showing "Plan vs. Actual" progress on a weekly basis, highlighting performance against set targets.