Major Routes Monitoring of Riyadh City
Python | Power BI | SQL | Rest Apis
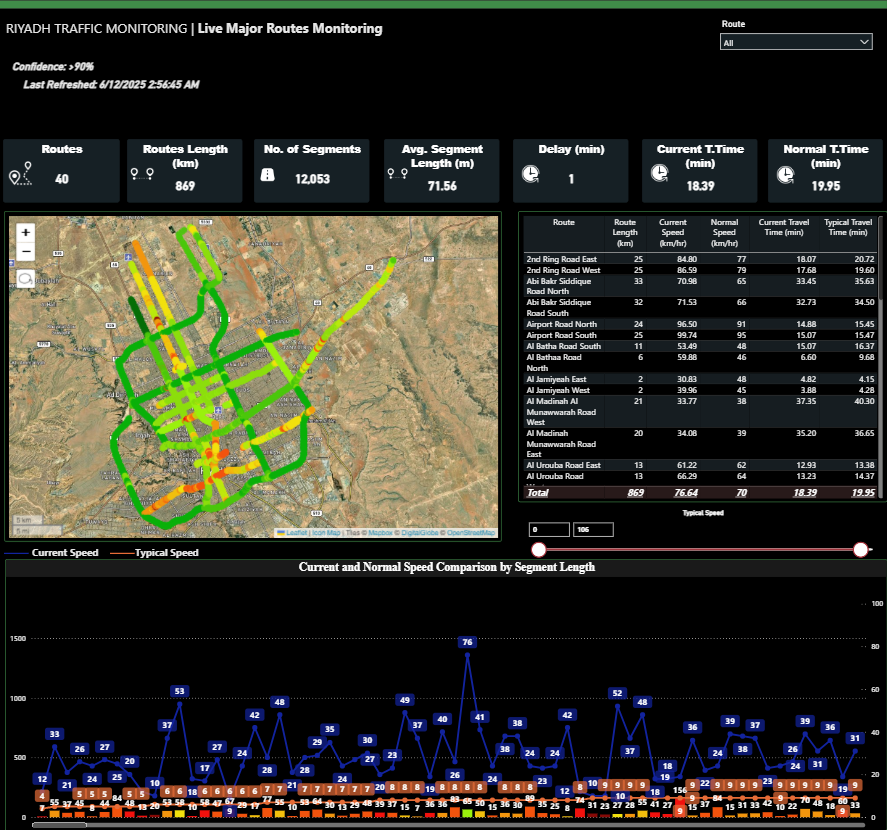
This interactive Power BI dashboard delivers real-time monitoring and analysis of Riyadh’s major traffic routes, enabling data-driven insights for urban mobility management. Leveraging geospatial visualization, the map highlights current traffic conditions with color-coded segments, providing instant clarity on congestion patterns.
Key metrics such as total routes, network length, segment count, average segment length, delay times, and both current and normal travel times are prominently displayed for quick decision-making. The integrated route-level breakdown presents travel times, speeds, and comparative analysis to typical conditions, helping stakeholders pinpoint problem areas.
The lower section features a segment-by-segment speed comparison chart, offering a clear visual of deviations between current and typical speeds, enabling deeper performance analysis. This solution supports proactive traffic management, operational planning, and the optimization of commuter experiences in one of the region’s busiest cities.