Riyadh Origin/Destination Analysis - RM vs Barca
Python | Power BI | SQL | Excel | MySQL
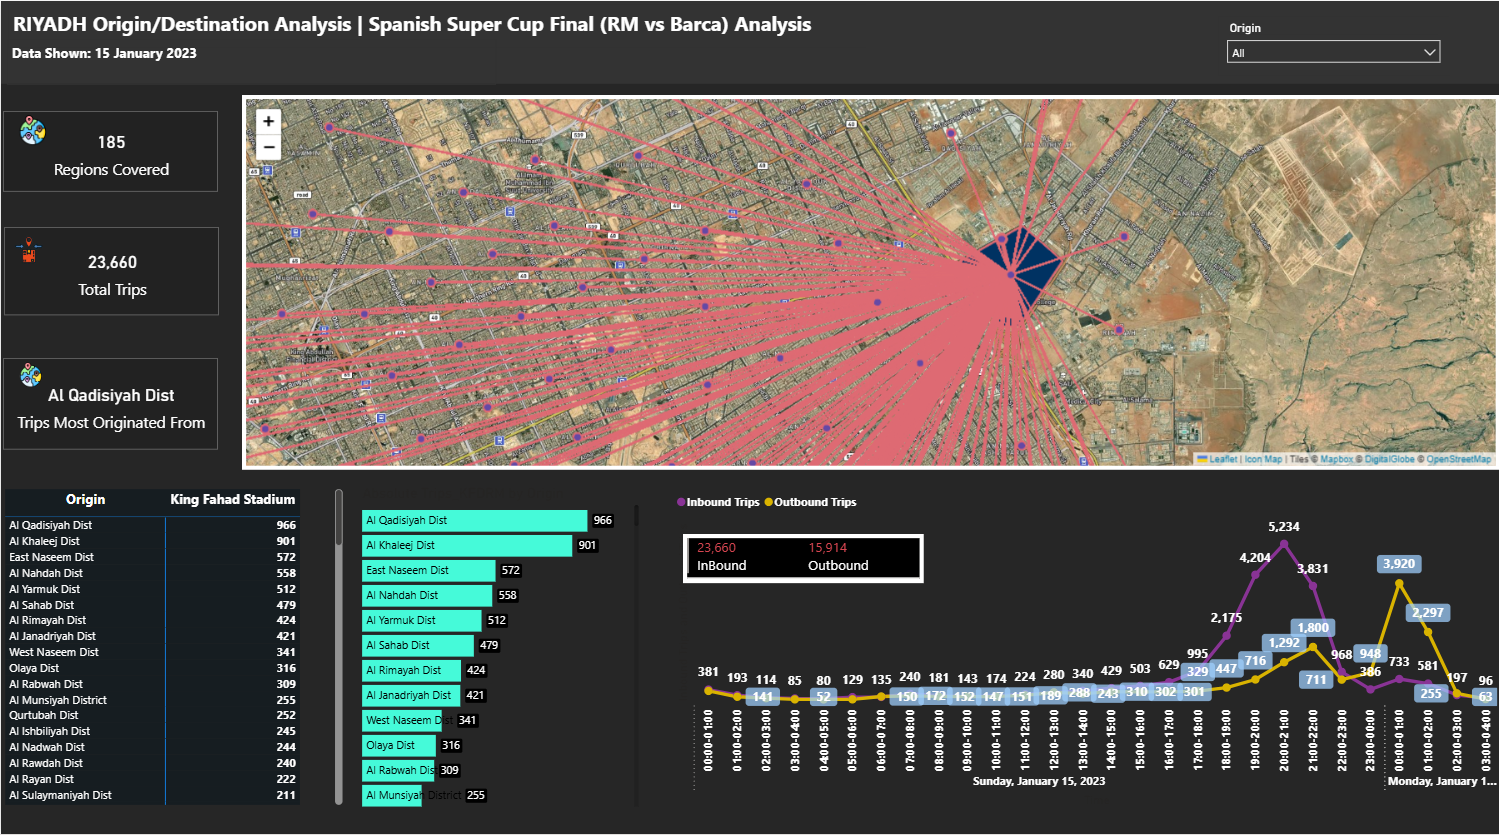
This event-specific Power BI dashboard analyzes the movement patterns of spectators attending the Spanish Super Cup Final at King Fahad Stadium on 15 January 2023. Covering 185 regions and 23,660 total trips, the dashboard offers actionable insights into crowd mobility and urban traffic behavior during large-scale events.
The geospatial flow map visualizes inbound and outbound trip trajectories, clearly illustrating the concentration of movements toward the stadium from various districts. Key statistics highlight top origin districts, with Al Qadisiyah and Al Khaleej leading in trip volume.
Supporting visuals include an inbound vs outbound trip comparison and a time-series breakdown of trip volumes, revealing peak congestion periods before and after the match. The dashboard also integrates bar chart comparisons for the top contributing regions, enabling event organizers, traffic planners, and city authorities to optimize traffic control, parking allocation, and public transportation strategies for future events.