Historical vs Live Comparison – Junction Analysis
Python | Power BI | SQL | Rest Apis
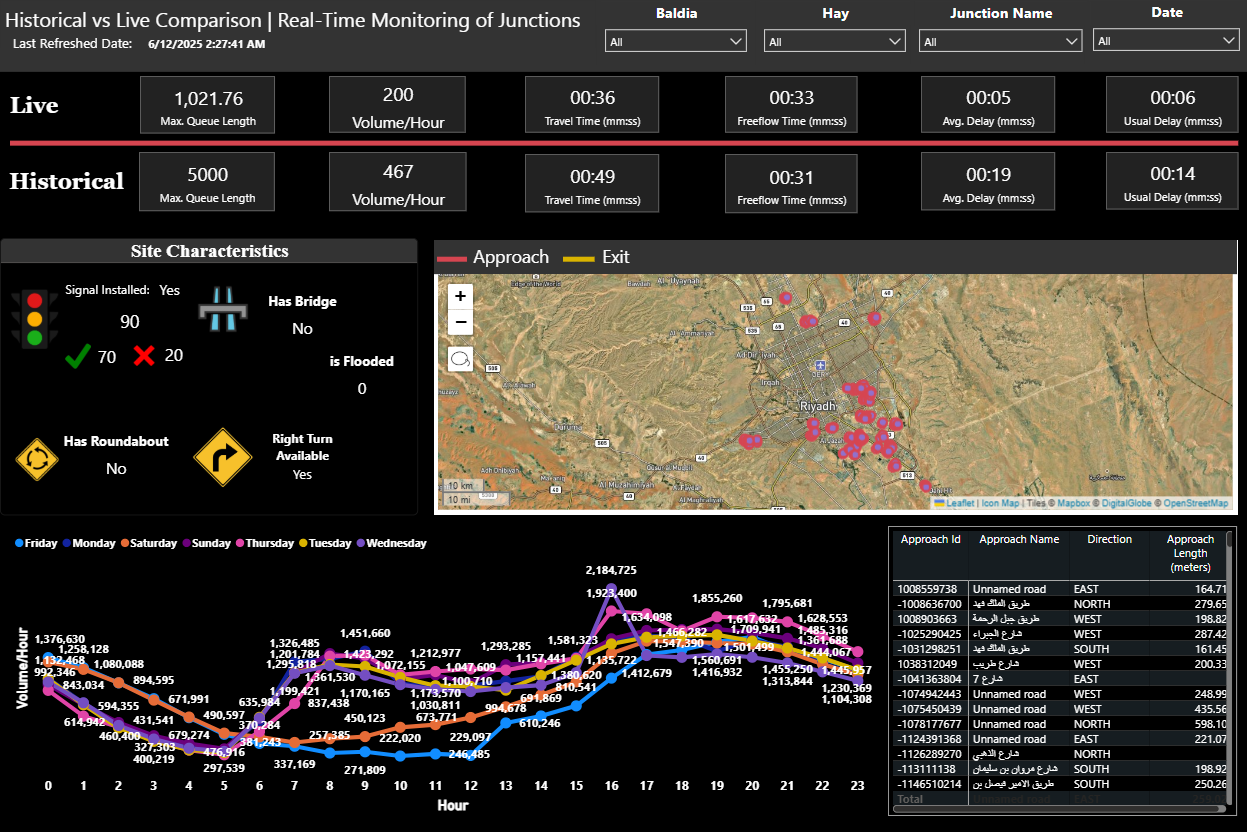
This Power BI dashboard provides a powerful comparative analysis between historical traffic patterns and live junction performance across Riyadh. It delivers key metrics such as maximum queue length, traffic volume per hour, travel times, free-flow times, and delay durations, enabling informed and data-backed traffic management decisions.
The interface features a live vs historical data panel for quick performance benchmarking, a map-based visualization highlighting monitored junctions, and detailed site characteristics, including signal presence, bridge availability, roundabouts, right-turn permissions, and flood status.
An interactive hourly volume trend chart breaks down traffic patterns by day of the week, uncovering peak congestion times for strategic planning. Additionally, a detailed junction-level breakdown provides approach direction, road names, and segment lengths for granular operational insights.
This solution equips city planners and traffic engineers with the tools to monitor, compare, and optimize junction efficiency, ensuring smoother urban mobility and reduced delays in a rapidly growing metropolitan environment.